In this series of Tableau Certification Questions for Tableau Desktop Certification exams, we will discuss Analytics in Tableau. The purpose of Tableau Certification Exam Questions part-7 is to explore Tableau Analytics targeting the Tableau Desktop Specialist or Certified/Qualified Associate exams. We have provided a complete step by step solution for each Tableau Analytics exam question at the end with the correct answer. Check out our detailed Tableau Certification Preparation Training Videos from Tableau Certified Professionals to explore further questions and tips for passing the exam on the first attempt.
- Tableau Desktop
- Tableau Certification Questions – Dashboard (Part 1)
- Tableau Certification Questions – Data Connections (Part 2)
- Tableau Certification Questions – Organizing and Simplifying Data (Part 3)
- Tableau Certification Questions – Tableau Chart Types and Field (Part 4)
- Tableau Certification Questions – Calculation (Part 5)
- Tableau Certification Questions – Tableau Mapping (Part 6)
- Tableau Certification Questions – Analytics in Tableau (Part 7)
- Tableau Server
- Tableau Certification Questions – Server Installation and Configuration (Part 8)
- Tableau Certification Questions – Server Preparation (Part 9)
- Tableau Certification Questions – Server Administration (Part 10)
- Tableau Certification Questions – Server Troubleshooting (Part 11)
- Tableau Certification Questions – Migration and Tableau Upgrade (Part 12)
Tableau Certification Practice Tests:


Tableau Certification Questions List:
Let’s dive into Tableau Certification Questions related to Analytics in Tableau. Also checkout Tableau Qualified Associate Certification here.
Question 1:
In which three months, the moving average of sales is less than actual sales. Use Order Sheet from Sample- Superstore Excel to answer this question.
Sample Data Source files & Packaged Files
- A) Mar 2010, Jun 2010, Jul 2010
- B) Feb 2010, Jun 2010, Jul 2010
- C) Jun 2010, Jul 2010, Dec 2010
- D) Jun 2010, Jul 2010, Jul 2011
Correct Answer: A
Checkout Solution:
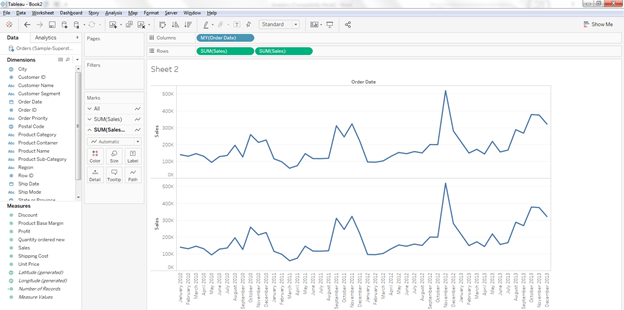
1. Put Order Date on Columns and Sales on Rows Shelf to show the monthly values

2. Again select Sales measure and put it on Rows shelf, it will create a second axis
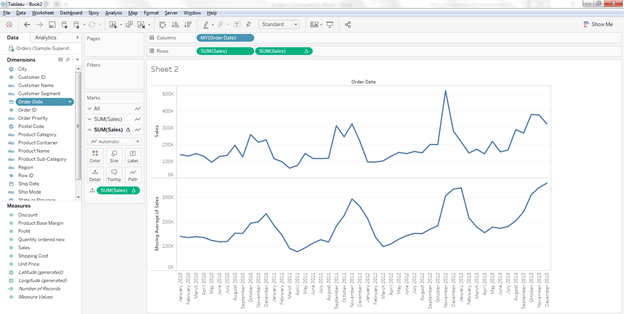
3. Select the right pill of Sales and select the option of Moving average as shown below

4. The view looks like this
5. Select the right pill of sales (having little arrow) and select Dual Axis option as shown below
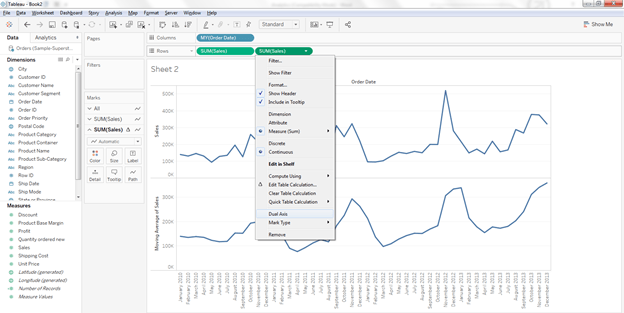
6. It will bring Moving Average and Sales on the same axis

7. Synchronize the both axis
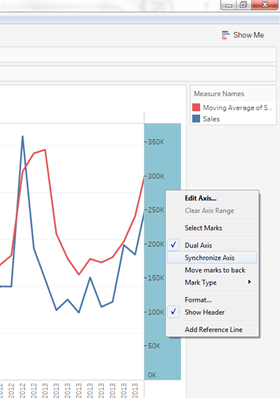
8. Graph will look like this

9. By Analyzing, it’s clear that the Moving average is less than actual sales in many months

10. But we can find out the months given in the answer options as below

Question 2:
Find the Shipping Mode which has Sales more than Express Air but Profit less than Regular Air. Use Orders Sheet in Sample – Super Store.
Sample Data: Super Store Data
- A) Express Air
- B) Regular Air
- C) Delivery Truck
- D) Data is insufficient to get this information
Correct Answer: C
Check out the Solution:
1. Put Sales on Columns and Profit on Rows Shelf.

2. Put Shipping Mode on the Detail on Marks Card, It will bring following three circles in the pane area.

3. By seeing the data in the Pane area, it is clear that Delivery Truck that more sales than Express Air and Lesser Profit than Regular Air.

 Fundamentals of Visualization with Tableau
- University of California via Coursera
- 11 hours of effort required
- 111,158+ already enrolled!
- ★★★★★ (4,671 Ratings)
 Data Visualization and Communication with Tableau
- Duke University via Coursera
- 25 hours of effort required
- 175,244+ already enrolled!
- ★★★★★ (2,852 Ratings)
 Tableau A-Z: Hands on Tableau Training for Data Science
- Kirill Eremenko via Udemy
- 9 hours on demand videos
- 230,147+ already enrolled!
- ★★★★★ (60,907 ratings)
Question 3:
Based on Ship Mode, Which customer segment has the highest Average Sales.
Sample Data Source files & Packaged Files
- A) Consumer
- B) Corporate
- C) Home Office
- D) Small Business
Correct Answer: B
Checkout the Solution:
1. Put Sales on Columns and Customer Segment on Rows shelf.

2. Put Ship Mode on Rows Shelf besides Customer Segment.

3. Right Click on Sales Axis and click on Add Reference Line Option.

4. Select the options as shown below:

5. Pane will show the following view:

6. From the following view, it’s obvious that average sales of corporate segment is higher.

Tableau Certification Practice Tests:
Related Articles:
