In Series of Tableau Certification Questions for Tableau Desktop Certification exams, we will discuss about Organizing and Simplifying Data. The purpose of this Tableau Exam Questions part-3 is to explore Organizing and Simplifying Data targeting the Tableau Desktop Specialist or Certified/Qualified Associate exams. We have provided a complete step by step solution for each exam question at the end with the correct answer. Check out our guide to Tableau Desktop Certification.
- Tableau Desktop
- Tableau Certification Questions – Dashboard (Part 1)
- Tableau Certification Questions – Data Connections (Part 2)
- Tableau Certification Questions – Organizing and Simplifying Data (Part 3)
- Tableau Certification Questions – Tableau Chart Types and Field (Part 4)
- Tableau Certification Questions – Calculation (Part 5)
- Tableau Certification Questions – Tableau Mapping (Part 6)
- Tableau Certification Questions – Analytics in Tableau (Part 7)
- Tableau Server
- Tableau Certification Questions – Server Installation and Configuration (Part 8)
- Tableau Certification Questions – Server Preparation (Part 9)
- Tableau Certification Questions – Server Administration (Part 10)
- Tableau Certification Questions – Server Troubleshooting (Part 11)
- Tableau Certification Questions – Migration and Tableau Upgrade (Part 12)
Tableau Certification Practice Tests:


Tableau Certification Questions List:
Let’s dive into Tableau Certification Questions related to Organizing and Simplifying Data in Tableau.
Question 1:
Using the Orders sheet in Sample-Superstore Excel File, We are interested to find what is the aggregated profit ratio of the Top 10 Customers by profit in the year 2012?
Choose the correct option:
- A) 40.64 %
- B) 13.11 %
- C) 2.6 %
- D) 5.39 %
Correct Answer: A
Checkout Solution:
Select the Customer Name field and click on Set Option as shown below
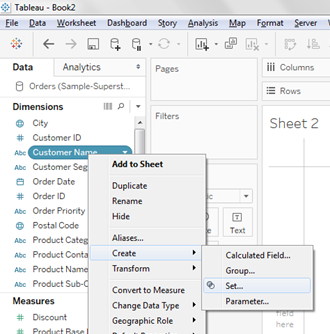
Select the top option as shown below and click ok, it will create a set with the name ‘Top 10 Customers By Profit’

Put Order Date field on the Filters shelf

Select the year 2012

Put this filter to context

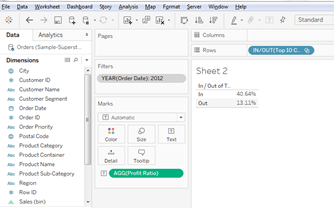
Put Set ‘Top 10 Customers By Profit’ on Rows shelf

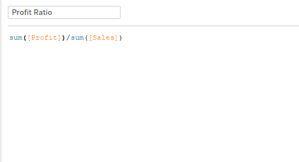
Create calculated field ‘Profit Ratio’
Put the Profit Ratio field on Text in the Marks card. It shows that For Top 10 Customers Percentage value is 40.64 %.
Question 2:
Create a histogram showing the number of sales using sales Bins of $1,000. Which bin has a Profit Ratio (profit as a percentage of sales) of more than 45% for year 2013?
Use the Sample-Superstore excel sheet to solve this.
Sample Data: Super Store Data
Choose the correct option:
- A) 10K
- B) 11K
- C) 12K
- D) 13K
Correct Answer: B
Check out the Solution:
1. Put Sales on the Rows shelf.

2. Click on Show Me.

3. Click on Histogram.

4. It will create the default Sales Bin in the Data Pane.

5. Right Click on Sales Bin in data pane and edit the Bin Size to 1000.

6. Put Order Date on Filters and select the Year 2013.

7. Create calculated field Profit Ratio.

8. Put calculated field ‘Profit Ratio’ on Text on Marks Card and make its format to percentage.

9. Going through the values, it’s clear that Sales Bin 11K has value more than 45 %.

10. Tooltip show the Profit Ratio as 47.64 which is greater than 45 %.

 Fundamentals of Visualization with Tableau
- University of California via Coursera
- 11 hours of effort required
- 111,158+ already enrolled!
- ★★★★★ (4,671 Ratings)
 Data Visualization and Communication with Tableau
- Duke University via Coursera
- 25 hours of effort required
- 175,244+ already enrolled!
- ★★★★★ (2,852 Ratings)
 Tableau A-Z: Hands on Tableau Training for Data Science
- Kirill Eremenko via Udemy
- 9 hours on demand videos
- 230,147+ already enrolled!
- ★★★★★ (60,907 ratings)
Question 3:
In which year aggregate Sales of product ‘3M Organizer Strips’ from ‘Office Supplies’ crossed 440.
Sample Data: Super Store Data
Choose the correct option:
- A) 2010
- B) 2011
- C) 2012
- D) 2013
Correct Answer: C
Check out the solution:
1. Put a filter of Product ‘3M Organizer Strips’.

2. Put Order Date on Columns shelf, Product Name and Product Category on rows shelf.

3. Now put Sales on Text on Marks card.

4. Now Right Click on Sales in the Marks Card and select the Running Total Option to show the aggregate sales (running total) for every year.

5. It show the following result and its clear that aggregate sales crossed 440 in year 2012.

Stay in touch for the next part in this series for Tableau Certification questions related to Field and Chart Types.
Related Articles:
