Do you believe Tableau, as a business intelligence tool, outperforms Quicksight? If so, should your company consider using it? Many business intelligence professionals ask this question on the internet. Having said that, Tableau currently has over 57,000 customer accounts that use Tableau in the office and are on the go to get quick results. Not only that, but over 300,000 people use Tableau Public to share publicly available data on their blogs and websites. Each Amazon QuickSight Standard edition account, on the other hand, can have up to 100 user accounts, including the AWS root account or IAM account that created the Amazon QuickSight account. In this blog, takethiscourse is here to tell you the real differences between Quicksight vs Tableau. You might be interested in tableau desktop specialist certification.
We’ll begin the feature by defining the two BI tools and then move forward with their pros and cons to help our users chose better. Without further ado, let’s jump right in!
- What is Tableau?
- What is Quicksight?
- Difference between Quicksight vs Tableau
- Availability of Dashboards
- Generating Visualizations
- Marketing Platform
- Business Intelligence
- Final Thoughts
What is Tableau?
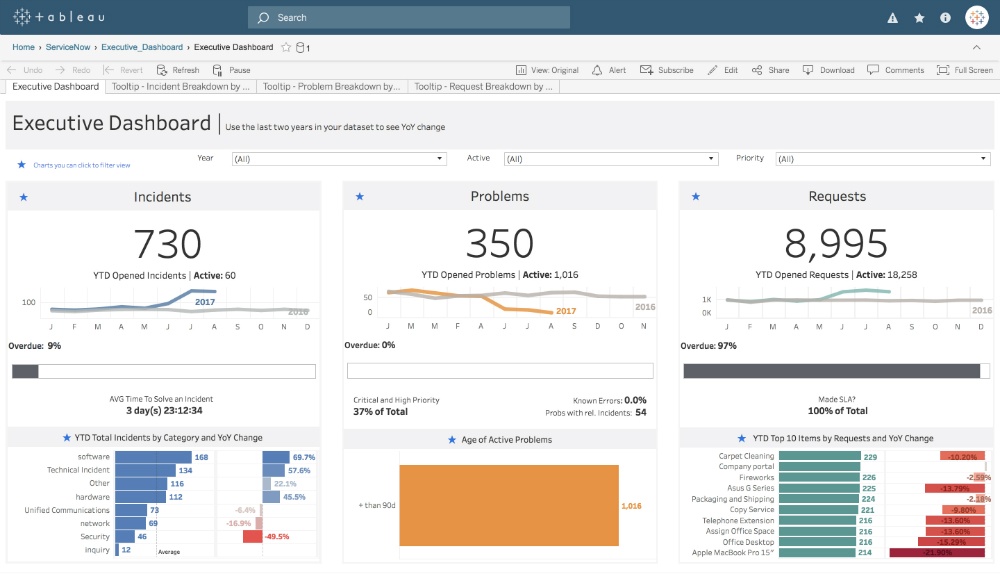
Tableau is a fast expanding visualization tool that is used for a variety of business applications. It is a popular software application owing to its simplicity of use, commonly used in Business Intelligence (BI) processes. Tableau is designed for various sorts of charts, plots, graphs and can also perform visualizations at the same time.
Tableau is an “immersive and convenient motion parallax exploratory research experience for corporate customers that allows easy access, mapping, and investigation aspects for data without any need for coding,” according to the researchers.
When it comes to data and its structural characteristics, as well as their direct exposure in tableau, users can collaborate on any set of information using Tableau, whether unstructured or structured datasets, with the availability of any programming language such as R, Python, SAS, and so on. If you’re interested in Splunk vs Tableau then click here.
 Fundamentals of Visualization with Tableau
- University of California via Coursera
- 11 hours of effort required
- 111,158+ already enrolled!
- ★★★★★ (4,671 Ratings)
 Data Visualization and Communication with Tableau
- Duke University via Coursera
- 25 hours of effort required
- 175,244+ already enrolled!
- ★★★★★ (2,852 Ratings)
 Tableau A-Z: Hands on Tableau Training for Data Science
- Kirill Eremenko via Udemy
- 9 hours on demand videos
- 230,147+ already enrolled!
- ★★★★★ (60,907 ratings)
What is Quicksight?
Amazon QuickSight is a cloud-based, robust, virtualized, inbuilt, AI-powered business intelligence (BI) provider. QuickSight enables developers to build and disclose engaging BI dashboards with Machine Learning-powered perspectives. QuickSight enables users with no programming skills to continue exploring data and derive various data sets. Further, it merges with a broad variety of data sources such as Amazon Redshift, Amazon Athena, local Excel files. QuickSight can manage various corporate areas while assessing key indicators autonomously. Check out the Best Online Quicksight Training Courses here.
Complete Introduction to AWS QuickSight [2021 Edition]
-
-
- Ian Littlejohn via Udemy
- 691+ already enrolled!
- ★★★★★ (147 Ratings)
-
Amazon (AWS) QuickSight – Getting Started
-
-
- Manuel Lorenz via Udemy
- 6,402+ already enrolled!
- ★★★★☆ (1,290 Ratings)
-
Mastering AWS Glue, QuickSight, Athena & Redshift Spectrum
-
-
- Siddharth Mehta via Udemy
- 12,935+ already enrolled!
- ★★★★☆ (1,982 Ratings)
-
Difference between Quicksight vs Tableau
The product’s selling point is the distinction between tableau platform and quick sight. As you are aware, the Quicksight platform is an ultra and concurrent model that assists in the creation of dashboards and visualizations in an equitable way, compatible with AWS sources, Salesforce, SQL, users must pay for each session they use, and costs are cost-effective for the consumers. The Tableau platform, on the other hand, is used by corporations and analyses massive datasets with built-in features. Further, the standard structure is preferred by small and big scale organizations and users need to pay $9 for one month using Quicksight while $840 annually using Tableau. You can checkout the difference between qlikview vs tableau vs power bi at takethiscourse.
Let’s show many other operational differences between Quicksight vs Tableau:
Availability of Dashboards
Tableau’s primary function is to create simple dashboards. The tool is used to manage large datasets. Also, it aids in visual analysis and facilitates the cognition of data. Marketing plan, visualization techniques, dashboard incorporation, performance analysis, revenue maximization, data analytics, actionable insights, and many other features are supported by the tool. The dashboards created in Tableau are visually appealing, while the learning curve of the quicksight tool is not easy to learn and creates simple dashboards. Quicksight is best suitable for ad hoc reporting as it provides easy to use user interface and creates fast visualizations for an easier data handling process.
According to saashub;
- Number of users making dashboards via Tableau: 94%
- Number of users making dashboards via Amazon Quicksight: 6%
Generating Visualizations
Another distinction between the quicksight platform and the tableau platform is the learning curve when creating visualizations. The quicksight platform is simple to use, and the tool’s setup time is significantly less than that of the tableau platform. The visualization created in the quicksight platform enables the user to visualize the data in a more accurate manner in a short period. The tableau platform necessitates more knowledge to use, and the learning curve is steeper. Before using Tableau to generate visual analysis, the user should have some prior experience. The user must prepare data and have prior knowledge before using the platform, which takes time.
According to saashub;
- Number of users making dashboards via Tableau: 96%
- Number of users making dashboards via Amazon Quicksight: 4%
Marketing Platform
The visualizations created by tableau’s platform are far more advanced than those created by Quicksight’s platform, increasing tableau’s popularity in terms of marketing in larger organizations. Needless to say, Tableau has multidimensional features and can be used to create real-time insights for data, whereas Amazon Web Services’ Quicksight is only used for data analysis and better data management. When the two tools are compared in terms of marketing maximization, Tableau is far more popular than Quicksight, which is mostly preferred by small-scale corporations.
Furthermore, the tableau platform is compatible with Windows, Mac OS, and cloud platforms. It also facilitates Android platforms, which improves social marketing for global brands. Quick sight’s platform, on the other hand, only facilitates the cloud platform and has many practical limits. That being said, if you want to provide the best possible customer service while working with a brand, you must use Tableau, and if you’re just starting out, Quicksight isn’t a bad option either.
According to saashub;
- Number of users making dashboards via Tableau: 100%
- Number of users making dashboards via Amazon Quicksight: 0%
Business Intelligence
Quicksight and Tableau are two competitors in the BI space. Quicksight instantly links to RDS (MySQL) and permits users to search the database to generate graphs, whereas Tableau is a self-service analytics and business intelligence platform that deals exclusively in analyzing and presenting data in visualizations, dashboards, and reports via on-premise, public cloud (using Tableau server), or online (Tableau Online). According to a Capterra user, Quicksight’s SPICE option creates a powerful index of the tables, some of which are very large. When your BI team has configured the dashboards and visuals in QuickSight, company executives can work on the dashboards to showcase the machine learning analysis. Keep in mind that Tableau vs Quicksight are both top BI tools.
According to saashub;
- Number of users making dashboards via Tableau: 93%
- Number of users making dashboards via Amazon Quicksight: 7%
All of the points mentioned above are significant differences between Quicksight vs Tableau. We have specifically distinguished the tools to assist you in seeing the wider context. (Mentioned values are not guaranteed by Takethiscourse). You can further check other BI tools comparisons like Spotfire vs Tableau, Tableau vs PowerBI and more.


Final Thoughts
Making smarter business decisions requires knowing the changing trends at all times. However, your ability to analyze that information – as well as the pace with where you can also unlock it – is vitally valuable. This is where Tableau comes into play. QuickSight is still a new player in the BI game, this explains Quicksight’s still growing number of users and expansion s a BI tool itself. Quicksight requires additional progression to compete with popular BI solutions such as Tableau. Despite the fact that both tools Tableau vs Quicksight are masters of visualization, Tableau steals the show!
