- Packt Publishing via Udemy
- 6,975+ already enrolled!
- ★★★★★ 4.6 (653 Ratings)
This course will walk you through the step-by-step process of designing successful dashboards. Starting with the fundamentals and working your way up to five distinct types of dashboards, each getting more complicated as you go. We will build a whole dashboard starting with the Strategic/Executive dashboard by developing a handful of the most typical dashboard components. The Tactical dashboard is the next stop, and it makes use of visualizations to illustrate progress and draw attention to key areas. To improve dashboard interaction and put more emphasis on fine information, operational dashboards will be investigated.
Analytical dashboards will be built using advanced Tableau techniques and will provide users with the tools they need to extract useful information from data. In addition, we’ll show you how to make a visualization using Ad-hoc dashboards so you may monitor certain interest regions. The training will also cover recommended practices and stylistic settings for publications. The “how and why” of each activity in the dashboard construction process will be explained in this course so that you can easily apply it to your own dashboard projects. There is an increasing need for user-friendly interfaces that can assist organizations in extracting insights from massive volumes of data and presenting them in a digestible fashion. A new category of business intelligence tools called Tableau makes it easier to analyze data and produce visually appealing representations of the findings.
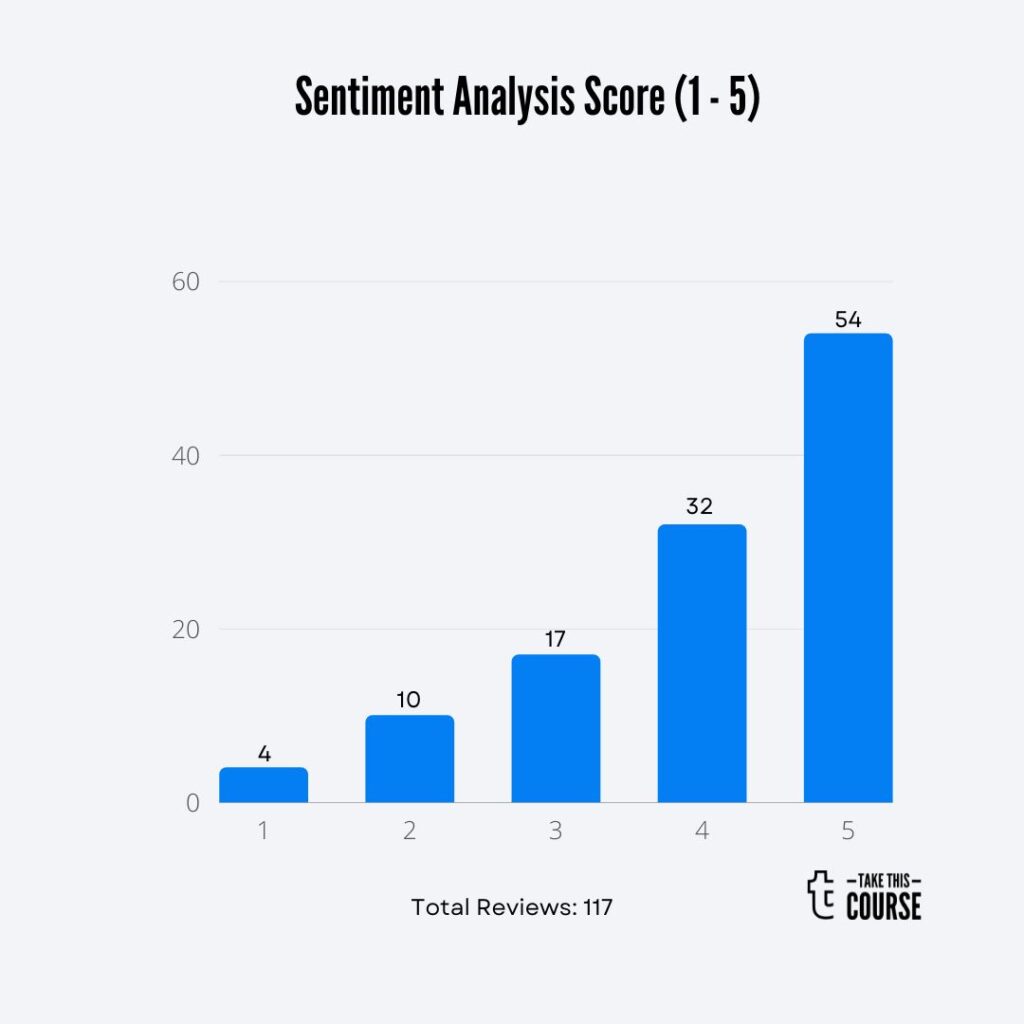
TTC Course Analysis:
Following are the results of comprehensive analysis of “Building Interactive Dashboards with Tableau” online course by our team of experts.
| TTC Rating 117 Reviews |
3.7 |
TakeThisCourse Sentiment Analysis Results:
In order to facilitate our learners with real user experience, we performed sentiment analysis and text mining techniques that generates following results:
- TTC analyzed a total of 117 reviews for this online course.
- The analysis indicates that around 73% reviews were positive while around 27% of reviews had negative sentiment.
- Pack Publishing’s online course received a total score of 3.7 out of 5, based on user opinions related to 4 effectiveness factors including content, engagement, quality practice and career benefit.
TTC Course Effectiveness:
| Online Course Effectiveness Score (Learn More) | |||
| Content | Engagement | Practice | Career Benefit |
| 4.0 / 5.0 ★★★★☆ 51 Reviews |
4.2 / 5.0 ★★★★☆ 60 Reviews |
4.3 / 5.0 ★★★★☆ 23 Reviews |
4.2 / 5.0 ★★★★☆ 20 Reviews |
Based on learner reviews we believe;
- This course is highly recommended because of its interactive and informative dashboards.
- The instructor is very knowledgeable which is clearly evident through their explanations and examples.
- They are dedicated to assisting and providing feedback to their students throughout the course because they want them to succeed.
- Students possibly used what they learned in a real-world environment through the course’s interactive tasks and exams. These exercises could have helped to clarify key ideas and point out areas that would benefit from more attention.

Pros & Cons:
Pros:
- Learn at your own pace.
- Concise content.
- Experienced instructors.
- Covers a range of dashboards from basic to advance.
- Provides practice exercises and quizzes to reinforce learning.
Cons:
- Technical difficulties.
- Limited interactions.
- Self-motivation.
What Learners Are Saying About this Course:
This section contains feedback that has been given by online learners about this course. Note that we have divided these reviews based on our main points mentioned below;
Content:
- Compared to other tableau classes on Udemy, this course moves at a quicker pace, I recommend gaining a fundamental understanding of tableau before joining. The method for developing industrial-level dashboards for executives, operations, analysts, and ad hoc situations is described in extensive detail, even with what has already been mentioned. I’ve taken several classes on Tableau, but nothing else comes close in this area. Highly recommended. (O H., ★★★★★)
- The course provided me with a well-organized overview of the many sorts of dashboards, along with features and advice for creating them. (Madina, ★★★★★)
Explore our guide on Tableau Certification Questions for expert insights into effectively organizing and simplifying data.
Engagement:
- The ‘Best’ Tableau course I have seen so far is this one. The instructor did a fantastic job of thoroughly explaining everything. Very convenient, and after completing the course, anyone can confidently design “Dashboards.” Tony, I appreciate your work and effort. (Chinmay, ★★★★★)
- I’m thrilled with the course overall. The instructions on how to develop various dashboards kinds that the teacher offers are really beneficial and applicable. He also shows us how to leverage various Tableau features, such as calculated fields, parameters, actions, and others, to let users of dashboards cut and dice data and drill down to more specifics. This course’s use of an earlier version of Tableau is its lone drawback. I’m hoping he can bring this lesson up to date by discussing LOD calculations in Tableau as well. (Farshad S., ★★★★★)
For detailed insights into Tableau Certification Questions – Mapping (Part 6), visit our comprehensive guide.
Quality Practice:
- Quickly practical ideas that are simple to understand. The instruction was straightforward and made sense. The Tableau tool and its use were covered in great detail. I believed there was enough information in this session to really make a start utilizing the tool comfortably and bringing changes to my dashboard right away. This course was beneficial to me as a new user, and I’m sure it will be equally beneficial to more experienced users. (Derrick S., ★★★★★)
- The material was provided in easily broken down, practical portions. During the session, some excellent advice and best practices were also disclosed. Anyone who designs dashboards in Tableau should definitely take this course, in my opinion. (Todd B., ★★★★★)
Learner’s Career Benefits:
- One of the finest Tableau lessons I’ve ever done, and being able to build these insightful, interactive dashboards with filters, highlights, parameter controls, embedded URLs, etc makes me stand out from my coworkers at work. (Doi A., ★★★★★)
- Excellent and informative course. In addition to learning about the core topic (building a dashboard), I also learned a bunch of really useful how-tos, which include how to apply absolute values in a heat map, switch between tiled and floating items and organize text elements on a dashboard in containers. I sincerely appreciate it. (Ursula B., ★★★★★)
- Stop reading this review right away and BUY THIS COURSE if you haven’t done so already! Even though I’m only halfway through, I’ve already learned more than I did in the previous six Tableau courses put together! And owing to this training, I’ve already impressed my coworkers with some of the dashboards I’ve created. CAN’T WAIT to see what’s in store for the future. Packt Publishing is to be commended for creating such a thorough course. (Lee C., ★★★★★)
Learner’s Suggestions/Recommendations:
- Tableau has an old collection of data, therefore it might be good to include fresh datasets in the analysis.
- Instead of merely just problem-solving, adopt a more interesting and instructive experience that would inspire research.
- As students complete the required readings and assignments, provide them with individualized comments and assistance. Individual coaching sessions, group conversations, or even an online forum where students may express questions and get feedback from their peers and the teacher might all be used to do this.
- To help students comprehend how to apply the topics they are learning, the instructor should include more case studies and real-world examples.
If you’re looking to advance your data visualization skills, check out our selection of Tableau Training and Certification Programs.
Is this Course worth taking?
In our opinion, it is highly recommended because it provides step-by-step instructions for every operation and starts with the fundamentals of creating a dashboard before moving on to more complex methods. The course additionally covers techniques and publishing guidelines for dashboards. In the end, the value of the course will rely on your personal learning objectives.
