Data blending is one of the salient features of Tableau which facilitates joining two data sources which are at two different levels of granularity.
Data blending is about working with multiple sources of data by preparing them and joining them together for a specific use case at a specific time.
Matthew Madden, Director of Product Marketing at Alteryx
How does Data Blending Work?
In order to use data blending, you should have two data sources where one data source will be considered as a primary data source and others will be considered as a secondary data source. Both data sources should be at granularity (level of detail). Like one data source contains daily data whereas other data source contains monthly figures of the same thing.
Data blending works on the pattern of Left outer Join, where all rows from the left table are returned along with matching rows from the right Table.


Some Interesting Facts about Data blending:
- Data blends compromise the query speed when used for data at high granularity.
- Linking field can be added or removed depending on your business requirement hence adding or restricting the additional rows from the secondary data sources in the blend.
- Data blend works on a sheet basis in the workbook. If you create a blend of data sources in one sheet, you have created the blend again if you want to use the blend on another sheet in the same workbook.
Explanation with Real-Time Scenario:
Let’s understand the concept with an example. We have data from a company which deals in sales of different types of products. We have a budgeting system that has monthly departmental budget figures. Whereas we have a separate system that records the daily sales of each employee. If we want to get a comparison of budgets versus sales for different departments, we can use the data blending feature of Tableau. We strong recommend to read of data security article here.
Solution Concept:
Following is the daily sales data which contains sales every 1st and 15th of the month for each employee in each department.
The following table contains the monthly target for departments.
In Order to get the desired result, we shall add these two data sources in the Tableau and make a blended view. In the blended view, we shall keep the Departmental Budget sheet as Primary data source since we want to show the report as department budget versus achieved sales.
As a behavior of data blend, it shows all rows from the primary data source.
Step by Step Solution in Tableau by using the Tableau Data Blending Option:
Go to Tableau and select the option of Microsoft Excel as a data source:
Select your Department Budget Excel file and name it Budget Data source as shown below:
Click on Add new data source to add another data source containing the employee wise sales. Go to the following option to add a new data source: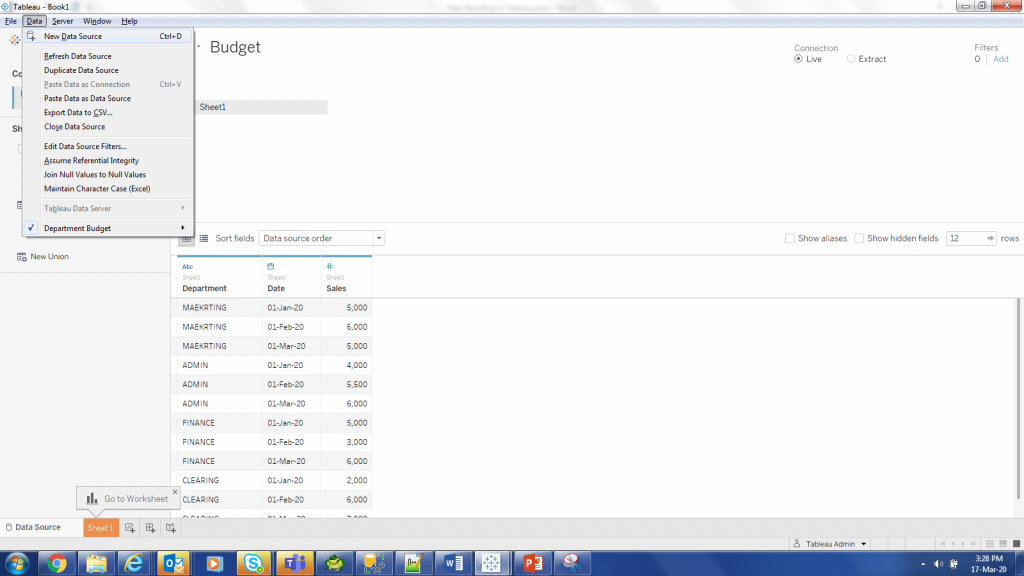
And again select the Excel Option:
Now Load the Employee Wise Sales excel sheet:
Now you have two data sources (Budget and Employee Sales) in the tableau as shown in the figure below:
Both data sources are available in the data pane: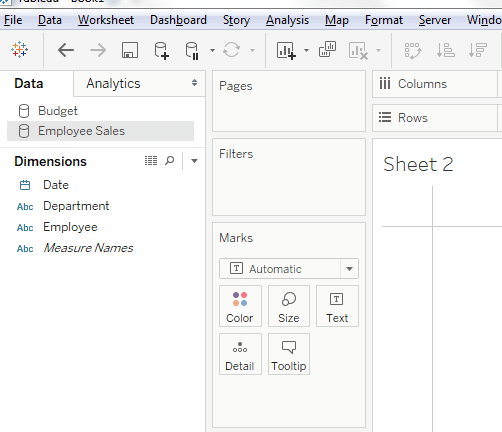
Click on the Budget data source and put the pills on the row and column shelves as shown below:
It will give the department wise budgeted values.
In Order to get the actual sales made for these departments, click the Employees sales data source and put the sales pill in the column shelf as shown below:

Note:
First bar graph represents the budgeted value for the department whereas the second bar graph (Bar on the right side) represents the actual sales.
It will automatically make the Employee Sales data source as orange indicating that this is a secondary data source.
Now we are able to compare the total budget of the department versus actual sales made by that department.
Moving to Next Level (Get Monthly Budget Comparison):
Now we want to compare the monthly departmental target against monthly sales for the same data.
Solution Concept:
This is very easy to do.
In order to achieve this, we shall create a calculation field in each data source that can be used for comparing/ linking the matching records in both primary and secondary data sources. Once we have a common field of the month, we shall be able to compare the department budget against sales achieved.
Step by step Solution:
Go to Budget data source and create a calculation field named ‘Month’ as shown below: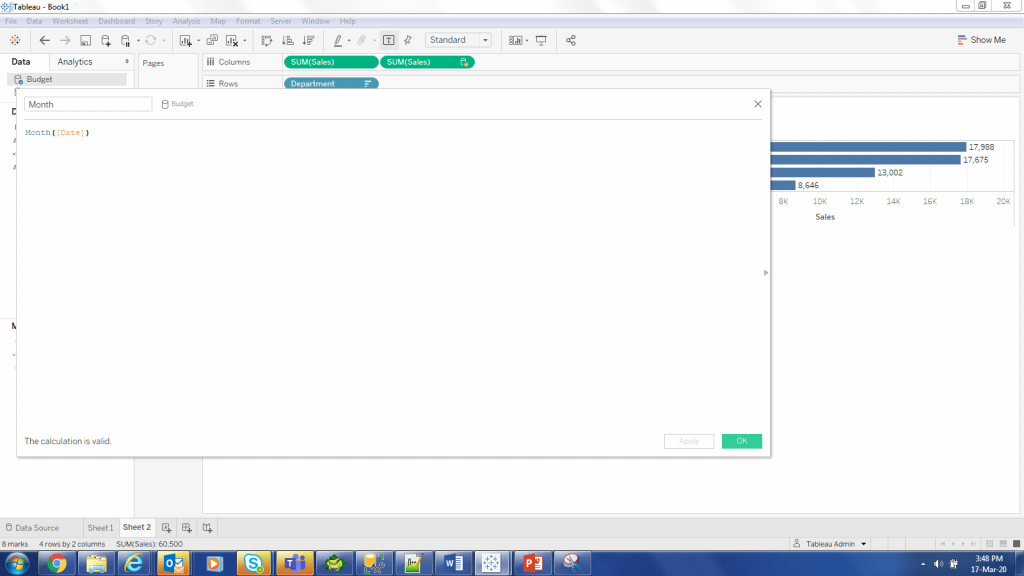
This will add a field in your data pane for Budget as shown here:
Same way go to Employee Sales data source and create a calculation data field Month:
Since it has the same name which exists in the earlier data source that’s why a grayed out clip icon has started to appear beside the Month field in Employee Sales data source.
Now select the month pill from Budget and put in the rows shelf:
Data pane will look like this now: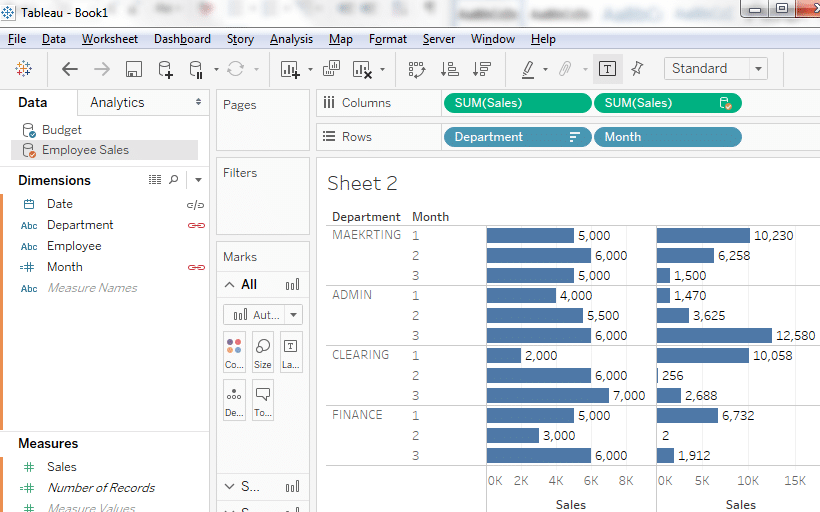
Clearly seen that it has started showing the monthly budget and monthly sales achieved for that department.

Download Resources:
Excel files and Tableau working files can be downloaded in order to understand the practice of the explained concept.
Author Bio:
Syed Farhan Ashraf is an expert professional working for enterprise BI solutions and helping his clients in managing large scale projects. He has expertise in data integrations, developing dashboards using Tableau, Python and other data visualization and analysis tools. An active member of the Tableau community in providing training and guidance to newbies.
