Business Intelligence tools are the tools that are specifically designed to process, analyze, gather, and visualize large volumes of past, current, and future data. Such tools help people to generate actionable business insights. Moreover, this software can be used to create interactive reports, and simplify the decision-making processes.
- Why Business Intelligence Tools are Important for Businesses?
- 5 Best Business Intelligence Tools 2021
- Final Thoughts
The Business Intelligence Analyst Course 2021
-
-
- 365 Careers via Udemy
- 144,084+ already enrolled!
- ★★★★★ (30,207 Ratings)
-
Why Business Intelligence Tools are Important for Businesses?
The reason why BI tools are of such importance is that they have amazing key features such as data visualization, visual analytics, interactive dashboarding, and KPI scorecards. Such features make the work a lot simpler for the user, as these let them automate reporting and predict analytics features based on self-service. In this article, our experts collected a list of 5 Best Business Intelligence Tools 2022. All of these software’s have been put to tests, and we ourselves use them. You might also be interested in Business Intelligence Analyst Salary Stats.

5 Best Business Intelligence Tools 2021
SAS
The first business tool that we recommend using is SAS. Now you may ask why SAS. Well, this brilliant software not only offers numerous products and technologies for data scientists. But it can also be used by text analysts, econometricians, forecasting analysts, data engineers, and optimization modelers, etc. SAS is a Visual Analytical tool. This Visual tool is offered via its cloud and microservices-based SAS Viya platform.
Don’t miss the chance to get certified in Business Intelligence for free with these top-notch courses.
This software is so intelligent that it automatically gets the job done of highlighting key relationships in data. Those key relationships can be the latest version that adds automated suggestions for relevant factors. Alongside this, SAS generates insights expressed via visualizations and natural language.
Another one of the reasons why this is such a good BI software is because of its Dynamic visuals. They are organized into interactive reports and dashboards. Furthermore, this software lets you integrate itself with Microsoft Office applications. MS applications include PowerPoint, Word, SharePoint, or Excel. The deployment for this software cab is on-premises. It can be done in public or private clouds or on the Cloud Foundry platform as a service. You can check out the comparison between Business Intelligence vs Data Analytics.
Zoho Analytics

Let’s talk about this BI tool. Although Zoho Anaytics’s company offers a lot more products ranging from CRM, bundles, and apps. For now, we will be looking at their BI and analytics solutions. Let us tell that this software has more than 10, 000 customers worldwide. Zoho Analytics is ranked as one of the best BI tools in the world.
What makes this tool so special? Let’s find out. Zoho is generally a robust solution. Which means it can let you integrate data from a variety of files, including Microsoft Office documents. You can even use it to get out data from URL feeds, or databases, such as MySQL, along with applications.
This software lets its user blend the data via integrated mathematical and statistical formulas.
Zoho even has an awfully smart assistant called Zia. You can use Zia to ask questions in form of natural language, and you will immediately receive the answer. The answer us in for of different reports and KPI widgets. Isn’t this awesome, having your own smart assistant? Check out the best Sisense Training Courses and Classes.
Business Foundations
-
-
- University of British Columbia via edX
- 6 weeks (3-5 hours weekly) of effort required
- 63,655+ already enrolled!
- ★★★★★
-
MicroStrategy
We are super pumped up to let you know about this software. This software itself is an analytical enterprise and a mobility platform. MicroStrategy mainly focuses on federated analytics, hyperintelligence, and cloud solutions. The smart use of their mobile dossiers can let anyone build interactive books of analytics that can even render on iOS or Android devices. Woah, right?! You even have the opportunity to extend the MicroStrategy content into their apps by using XCode or JavaScript.
You can even use it to leverage existing investments in data sources such as Tableau, Qlik, and Power BI. Later on, you can simply blend the data to build reports and insights.
Moving on, you will also find really good features in this software such as semantics graph. Semantics graphics is a feature that files data assets to improve data silos with location intelligence and real-time telemetry. It even has a smart voice integration technology. Using this feature, you can integrate voice technology and chatbots such as Alexa or Google Home.
Dundas
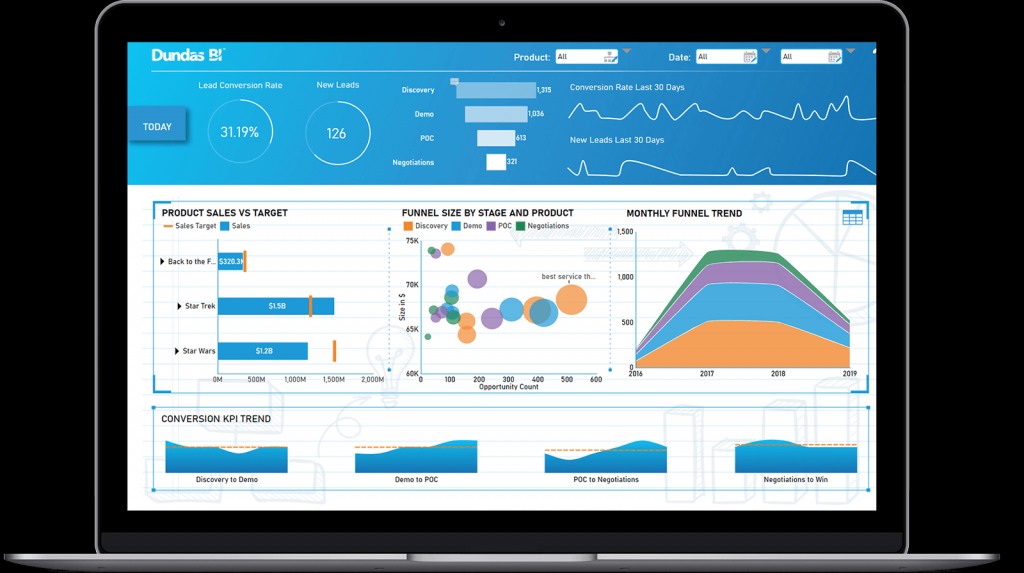
Now talking about Dundas. Our experts summarize its definition by saying that it is a browser-based business intelligence tool. This tool has been in the market for 25 years. It is a simple-based designed tee; that lets anyone transform data into visual data analytics. What so special about this software is that it lets you have granular control over almost all visual design elements.
Dundas has been used by the users to create dashboards and scorecards, and the company’s historic strengths. This software can also help to perform standard and ad-hoc reporting. The process of analysis and visualization are delivered through a web interface that can adapt to users’ skills.
In the newest version of Dundas, there is a new natural language query capability. Moreover, you can get adds point-and-click trend analysis. Dundas also supports an application development environment which is for customized analytic applications. To conclude, we say that Dundas specializes in embedded BI.
Tableau
In the end, let’s talk about the very famous Tableau. A tableau is a wide software. You can do a lot more through this software other than just making charts. Tableau is very much used for live visual analytics. Live visual analytics, is actually a pretty smart technology letting users drag and drop buttons to spot trends in the data.
This software can work on-premises, choose a public cloud, or you can choose to have it fully hosted by Tableau. What’s more, is that Tableau has different versions for different marketing setups. You will find different versions for fields such as banking, healthcare manufacturing, finance, IT, etc.


Recently, Tableau came up with a really great trick. Tat trick is to simply draw on the artificial intelligence techniques of natural language processing. This lets the user specify what they want to see, other than clicking and dragging to create formulaic questions. Tableau supports a huge list of data sources, such as Google Analytics Microsoft Excel, Box, and PDF files.
Excel to MySQL: Analytic Techniques for Business Specialization
-
-
- Duke University via Coursera
- 7 months (4 hours weekly) of effort required
- 171,642+ already enrolled!
- ★★★★★ (10,257 Ratings)
-
Advanced Business Analytics Specialization
-
-
- University of Colorado Boulder via Coursera
- 15 hours of effort required
- 39,769+ already enrolled!
- ★★★★☆ (1,665 Ratings)
-
Final Thoughts
Data is all around us. It can be big data or small data, and it continues to increase each year. Using business analytics tools comes in handy. It can actually help you to reap great rewards. So, we are happy that we made this list of 5 Best Business Intelligence Tools 2022. Hope you find this article helpful. Stay safe and keep learning.
